WordPress Built-in Utilities for Site Monitoring and Troubleshooting
Written by Theo Zimmermann · Aug 24, 2026

WordPress Built-in Utilities for Site Monitoring and Troubleshooting
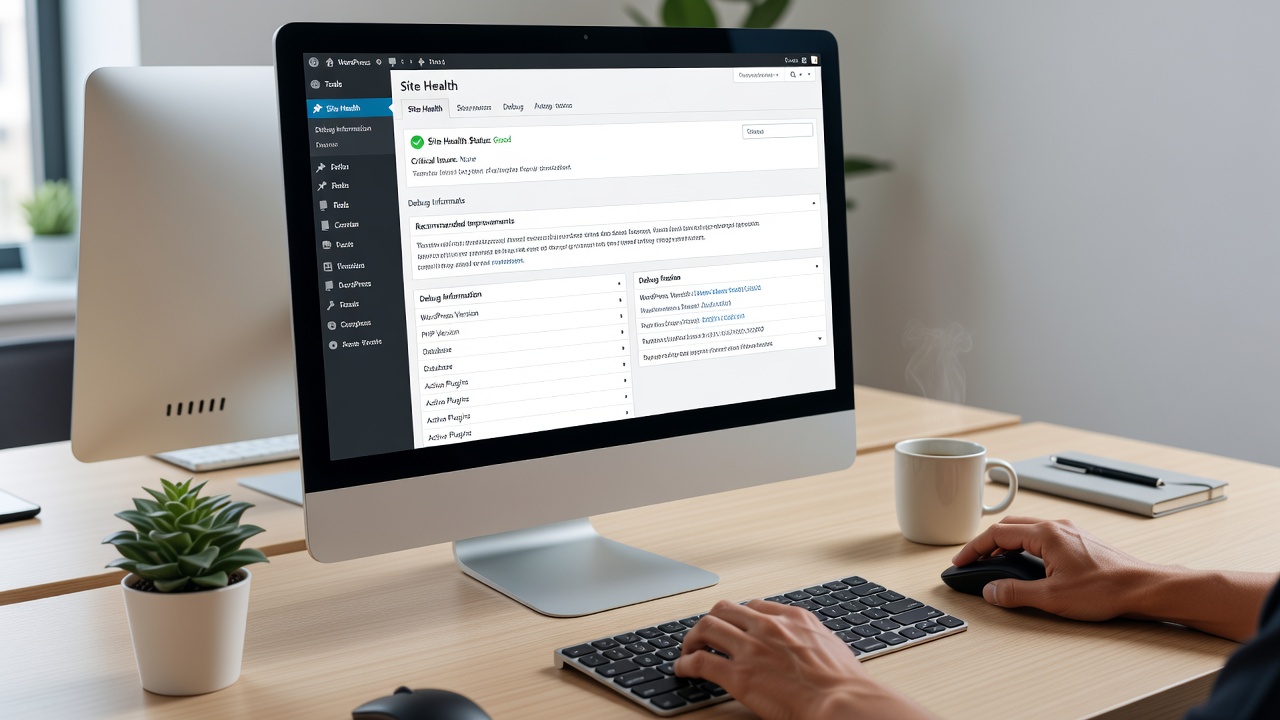
WordPress includes dedicated screens and configuration options that allow site operators to review overall system status while identifying potential issues through structured checks and logging mechanisms. The Site Health feature, introduced in version 5.2 and refined across subsequent releases, presents categorized assessments covering security, performance, and compatibility elements. Administrators access this panel directly from the dashboard menu under Tools, where automated scans evaluate the environment against established criteria and generate prioritized lists for review.
Core Components of the Site Health Interface
The interface divides results into critical problems requiring immediate attention alongside recommended improvements that enhance stability over time. Each item displays detailed explanations along with suggested actions, and data comes from internal WordPress functions that query server configurations, active extensions, and core file integrity. In August 2026 observers note continued emphasis on HTTPS enforcement checks and PHP version compatibility as WordPress evolves alongside broader web standards.
Status indicators use color coding and numeric scores to represent overall site condition, while expandable sections provide deeper context for each finding. Users can copy debug information from a dedicated tab that aggregates server details, active theme data, and plugin lists for sharing with support teams when needed. This output remains formatted for easy pasting into tickets or forums without exposing sensitive credentials.
Activating Debug Mode Through Configuration Files
Developers enable detailed error reporting by editing the wp-config.php file located in the root directory and setting the WP_DEBUG constant to true. Additional constants such as WP_DEBUG_LOG direct output to a debug.log file within the wp-content folder, whereas WP_DEBUG_DISPLAY controls whether errors appear on the front end. These options operate independently, allowing background logging without visible disruptions to visitors.
Once activated the system records notices, warnings, and fatal errors generated during page loads, which helps isolate conflicts between plugins or themes. Site owners often combine this approach with query monitoring by defining SAVEQUERIES as true, capturing database calls for later analysis in the footer or custom templates. Deactivation occurs simply by reverting the constants, restoring production behavior without residual files unless manual cleanup follows.
Interpreting Logs and Resolving Common Issues
Log files accumulate entries with timestamps, file paths, and stack traces that pinpoint exact locations of errors within codebases. Administrators review these records through FTP access or hosting control panels, searching for patterns such as repeated plugin hooks triggering conflicts. Data shows that many reported issues stem from outdated extensions rather than core WordPress files, prompting regular maintenance cycles documented in official release notes.
According to resources available at wordpress.org documentation, systematic testing involves isolating components by deactivating plugins sequentially while monitoring log changes. Hosting providers frequently supply complementary server-level logs that complement WordPress output, creating a complete picture of request handling from initial connection through rendering.
Integrating Health Checks With External Monitoring Practices
Site operators incorporate built-in tools into broader workflows by scheduling periodic reviews alongside automated uptime services offered by third-party platforms. Evidence from industry reports indicates consistent use of these native features reduces downtime incidents across managed installations. Research from academic sources such as those published by the University of Waterloo highlights how structured debugging correlates with faster recovery times in content management environments.
Additional constants like SCRIPT_DEBUG force loading of uncompressed assets during testing phases, aiding identification of JavaScript or CSS conflicts that might otherwise remain hidden. Combined with the Site Health screen this layered strategy provides multiple vantage points for assessing site reliability without requiring external plugins in initial stages.
Conclusion
WordPress equips users with accessible pathways to monitor system health and capture diagnostic data through configuration constants and dedicated dashboard sections. Regular engagement with these utilities supports proactive maintenance across diverse hosting setups and deployment scales. Administrators who establish routines around log review and status checks maintain operational continuity as platform requirements advance.